Analytics Dashboard
Intro
Rumi’s Analytics Dashboard gives instructors and administrators powerful tools to see how Rumi and AI are being used across classes or at the institution level. It provides insights into student engagement, assignment creation, and AI usage patterns. Instructors can track how students draft essays, which prompts are used most often, and how AI policies shape learning behaviors. Administrators gain a broader, institution-wide view that highlights adoption trends, pinpoints impactful features, and surfaces opportunities for targeted support or training.
By combining high-level usage metrics with AI-specific analytics, the dashboard makes it easier to measure adoption, evaluate effectiveness, and assess the impact of AI on student learning outcomes. These insights empower educators to make informed decisions, adjust instructional strategies, and ensure that AI is being used responsibly and effectively.
How to Access
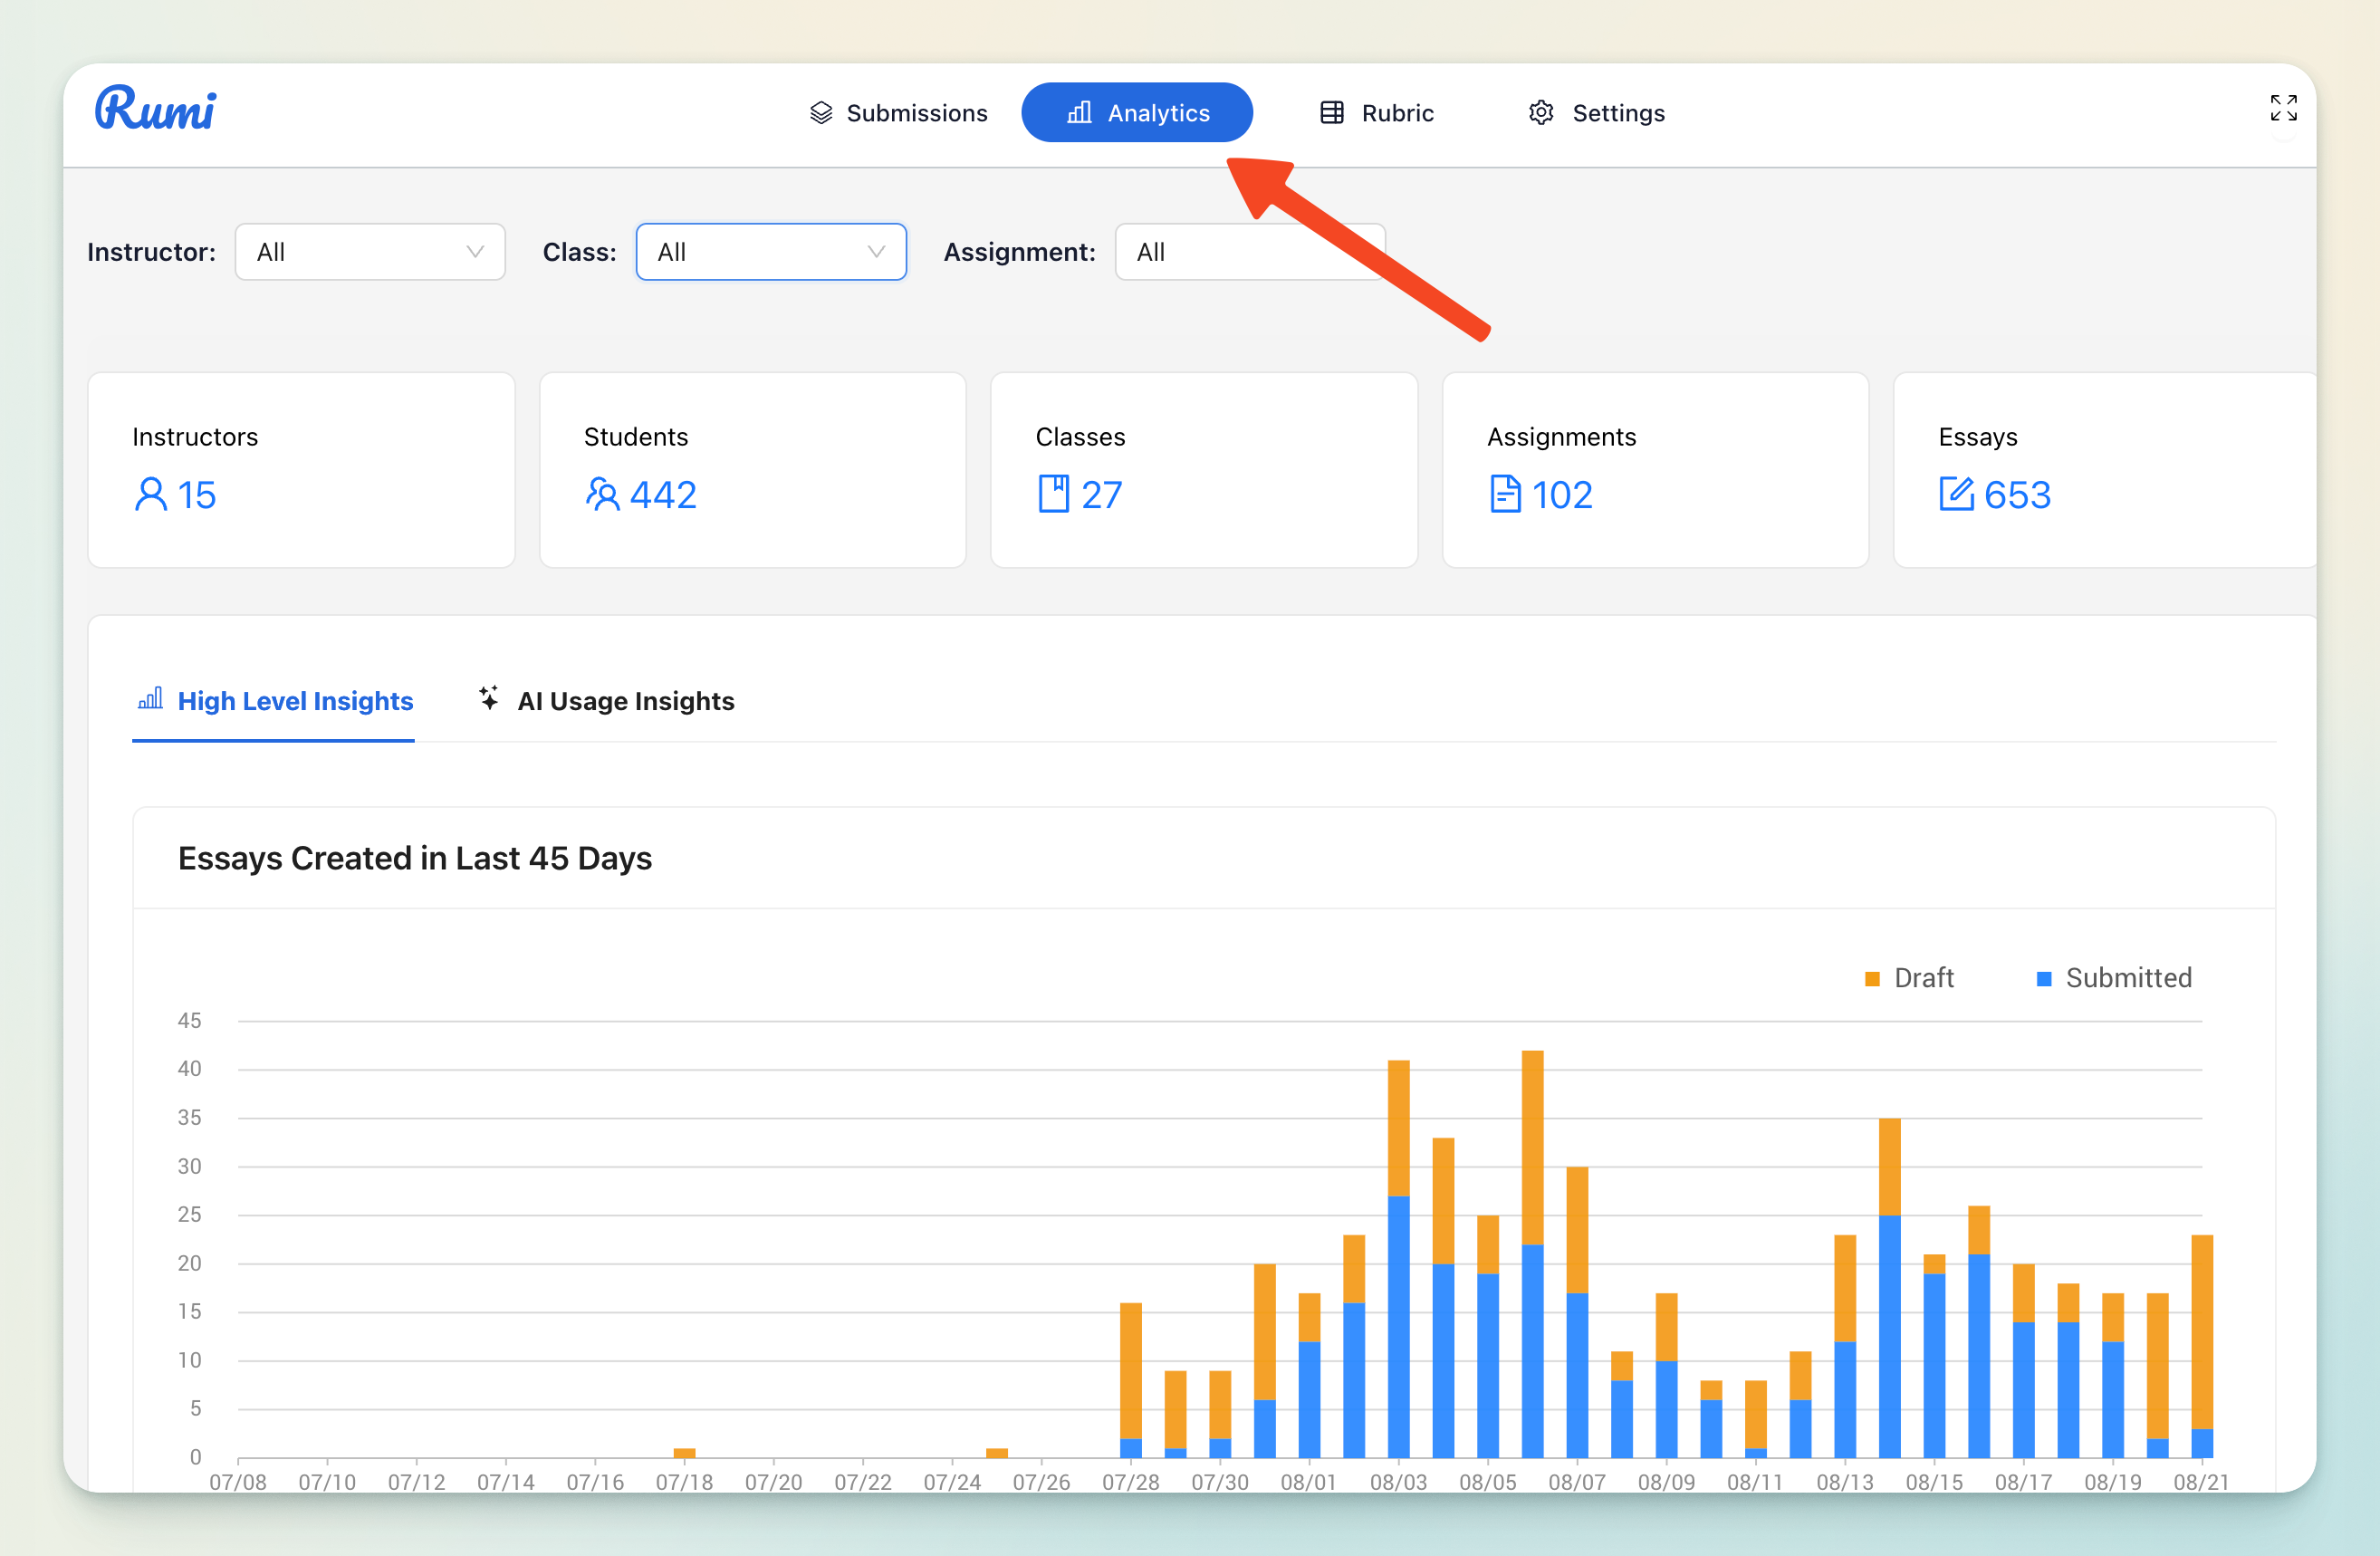
To open the Analytics Dashboard, open any Rumi assignment (or create a new one). For the assignment make sure there is at least one draft essay for the assignment. Then click the “Analytics” button from the Rumi dashboard. This will take you directly to the analytics view.
Filtering
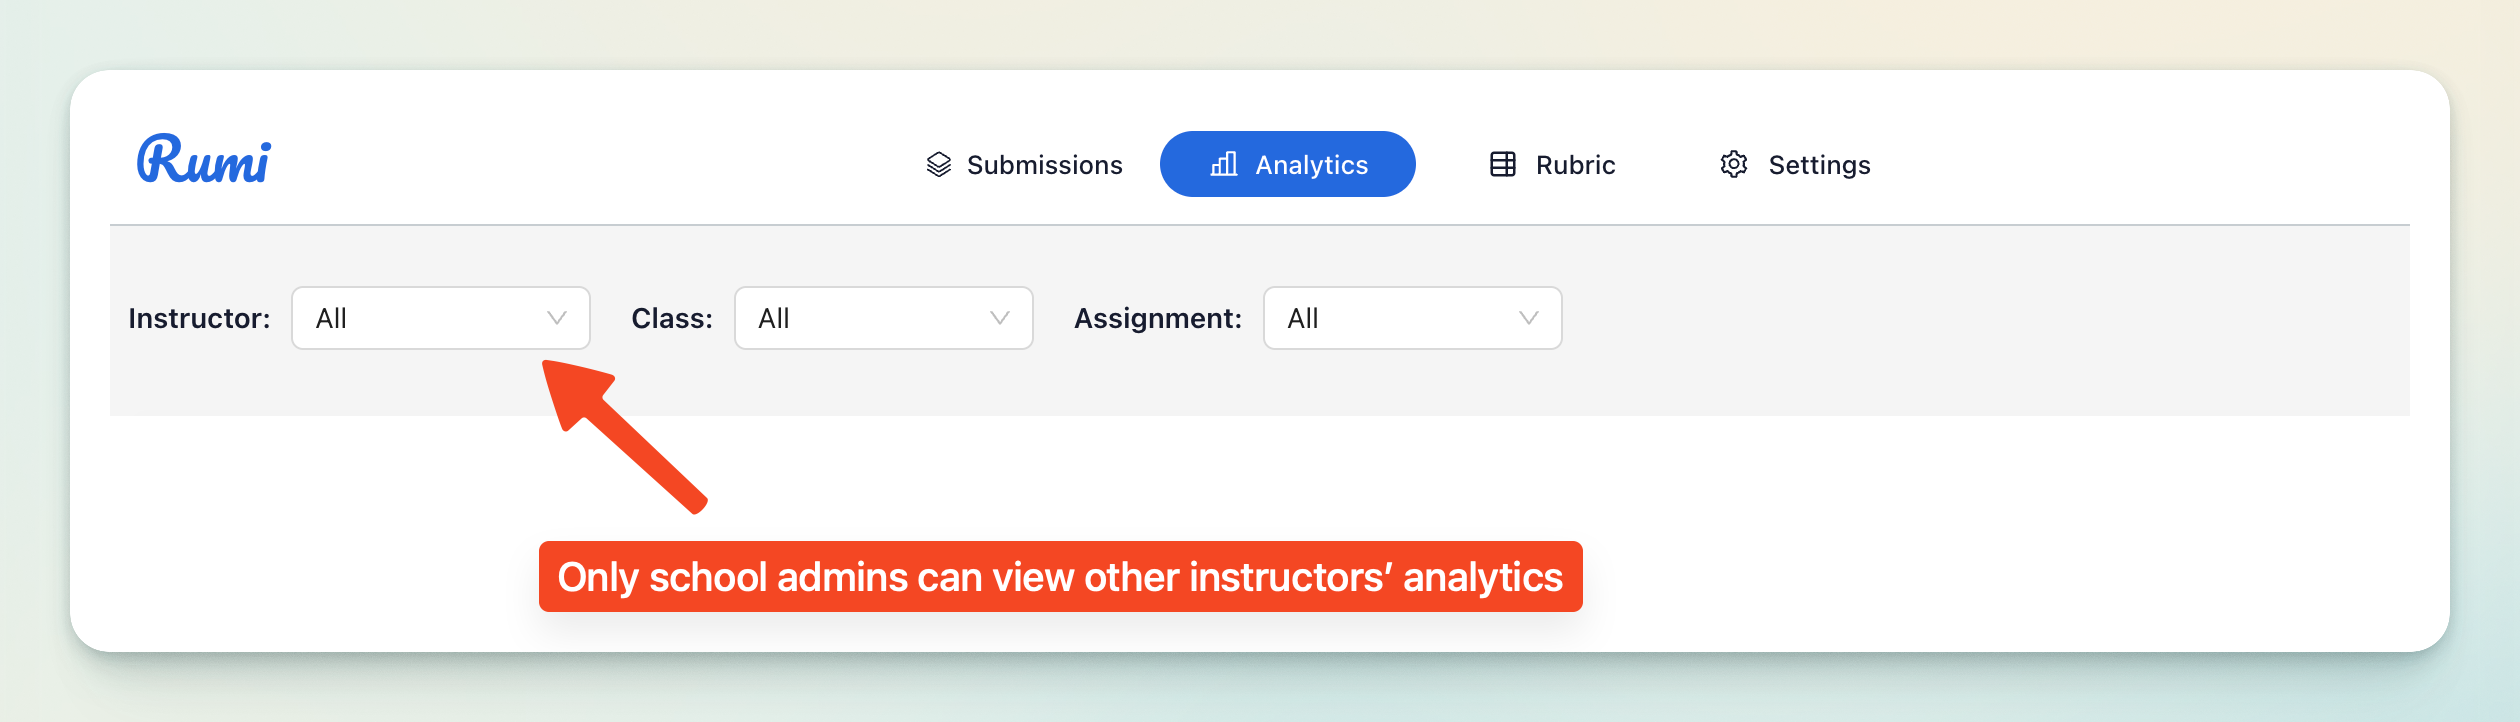
The dashboard includes filtering tools to let you narrow results by Instructor, Class, or Assignment.
- School Administrators can view analytics across all classes and instructors, providing institution-wide visibility.
- Instructors can view analytics only for their own classes and assignments, giving them a focused view of how their students are using Rumi.
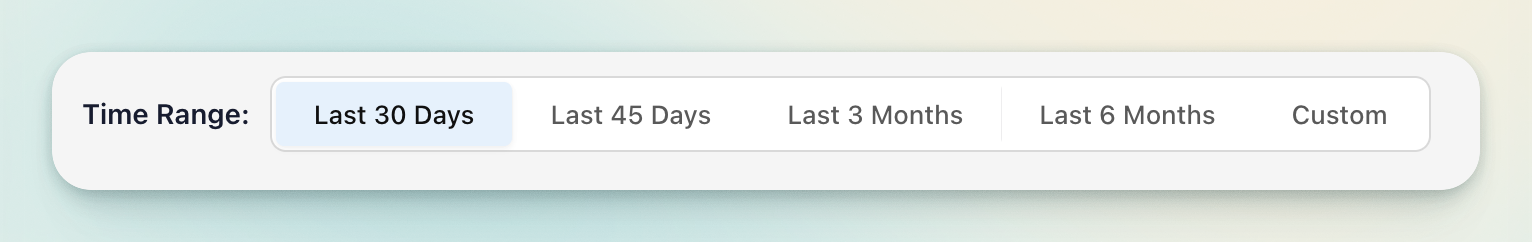
Time Range
You can select the time range for the analytics.
Analytics
The Analytics Dashboard is divided into two main tabs:
- High-Level Insights – general usage metrics for Rumi.
- AI Usage Insights – detailed analytics on AI usage and policy settings.
1. High-Level Insights
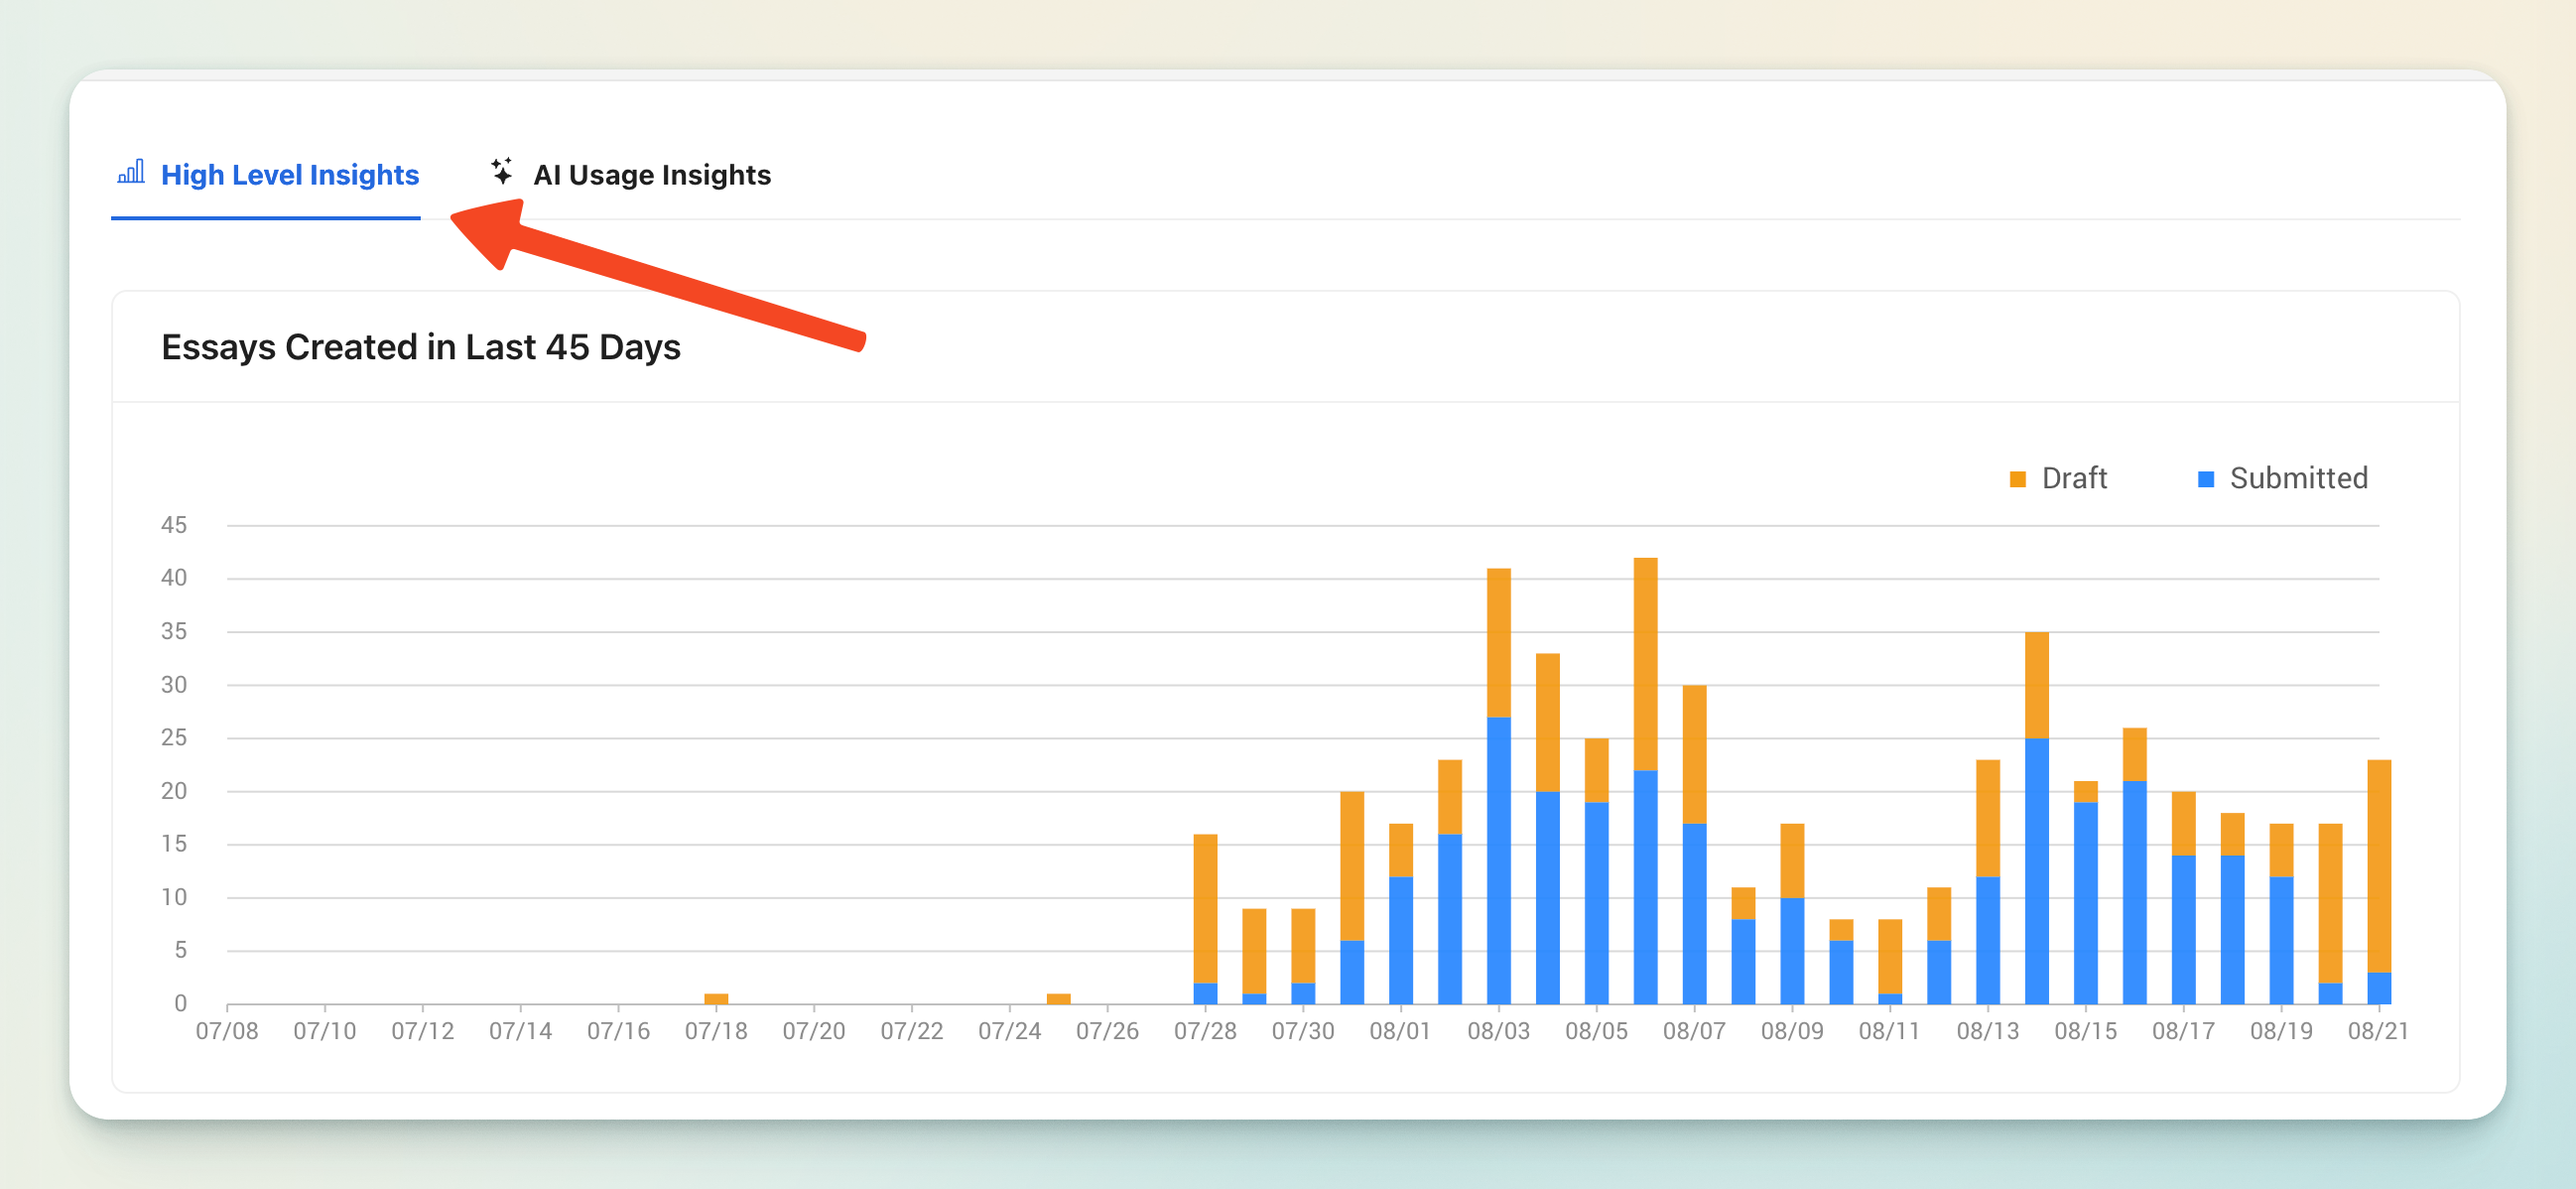
This tab provides a broad overview of activity within Rumi, including:
- Essays Drafted in the Last 45 Days – shows overall writing activity and student engagement.
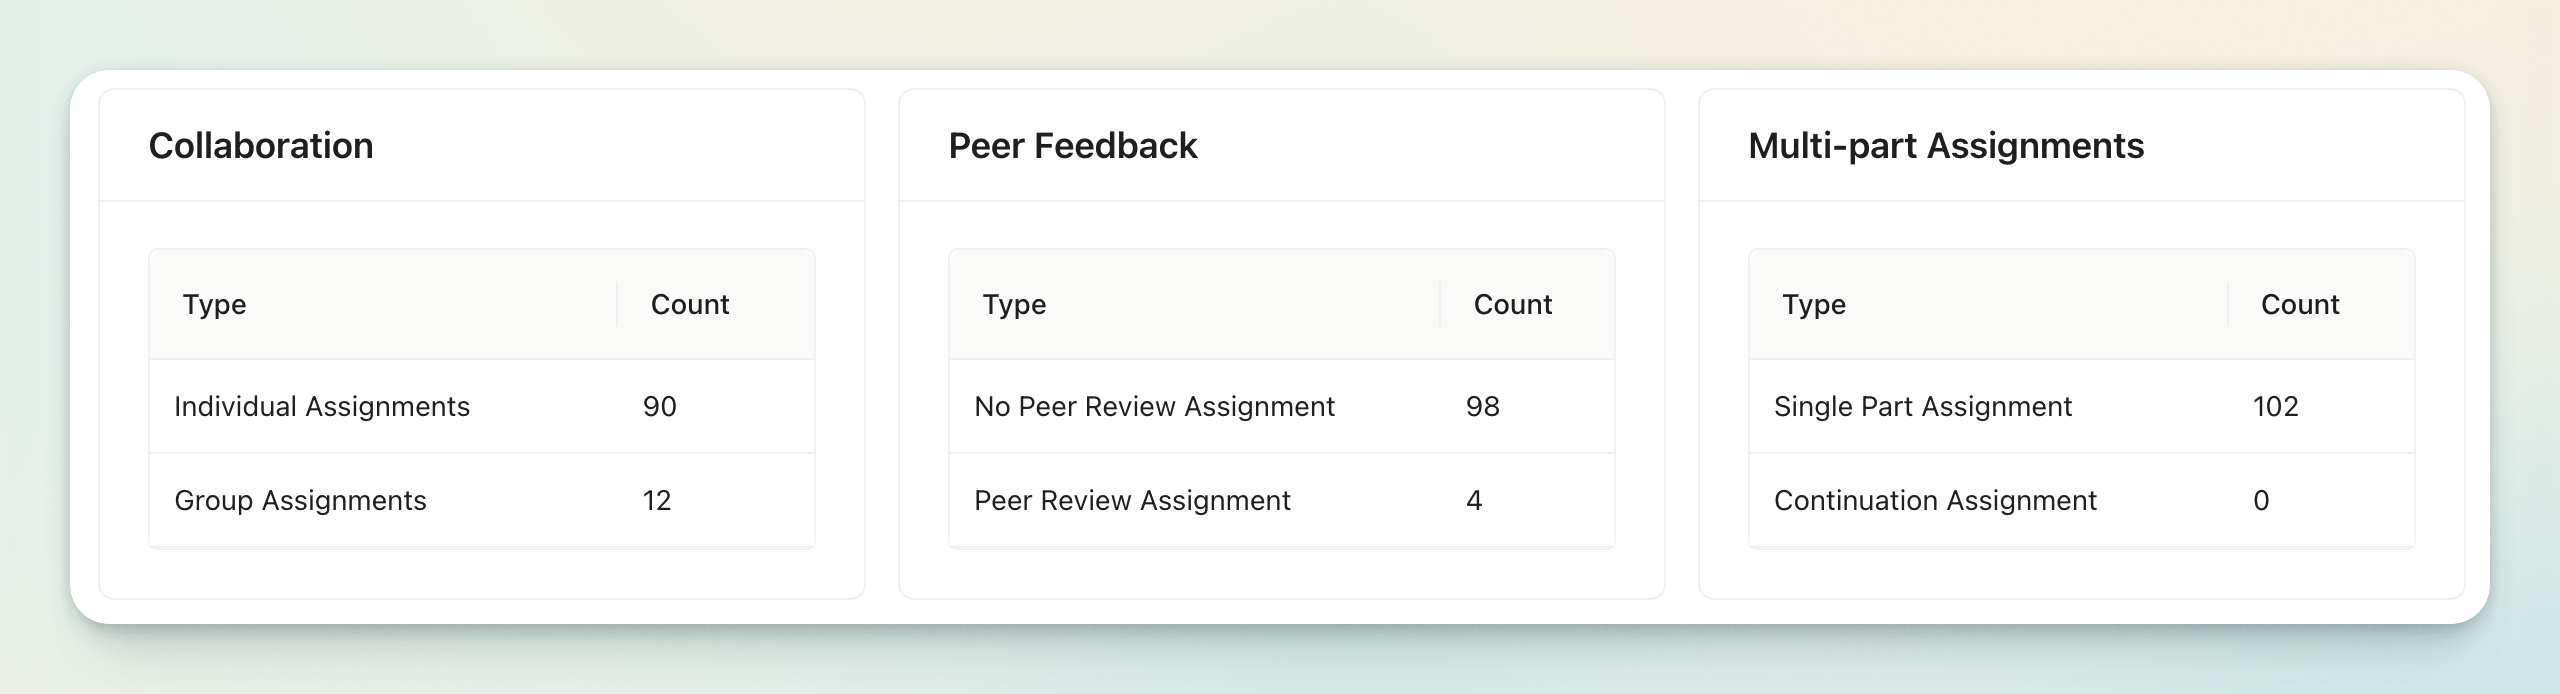
- Assignment Type Metrics – breaks down the different kinds of assignments created in Rumi (e.g., essays, peer review, group projects).
2. AI Usage Insights
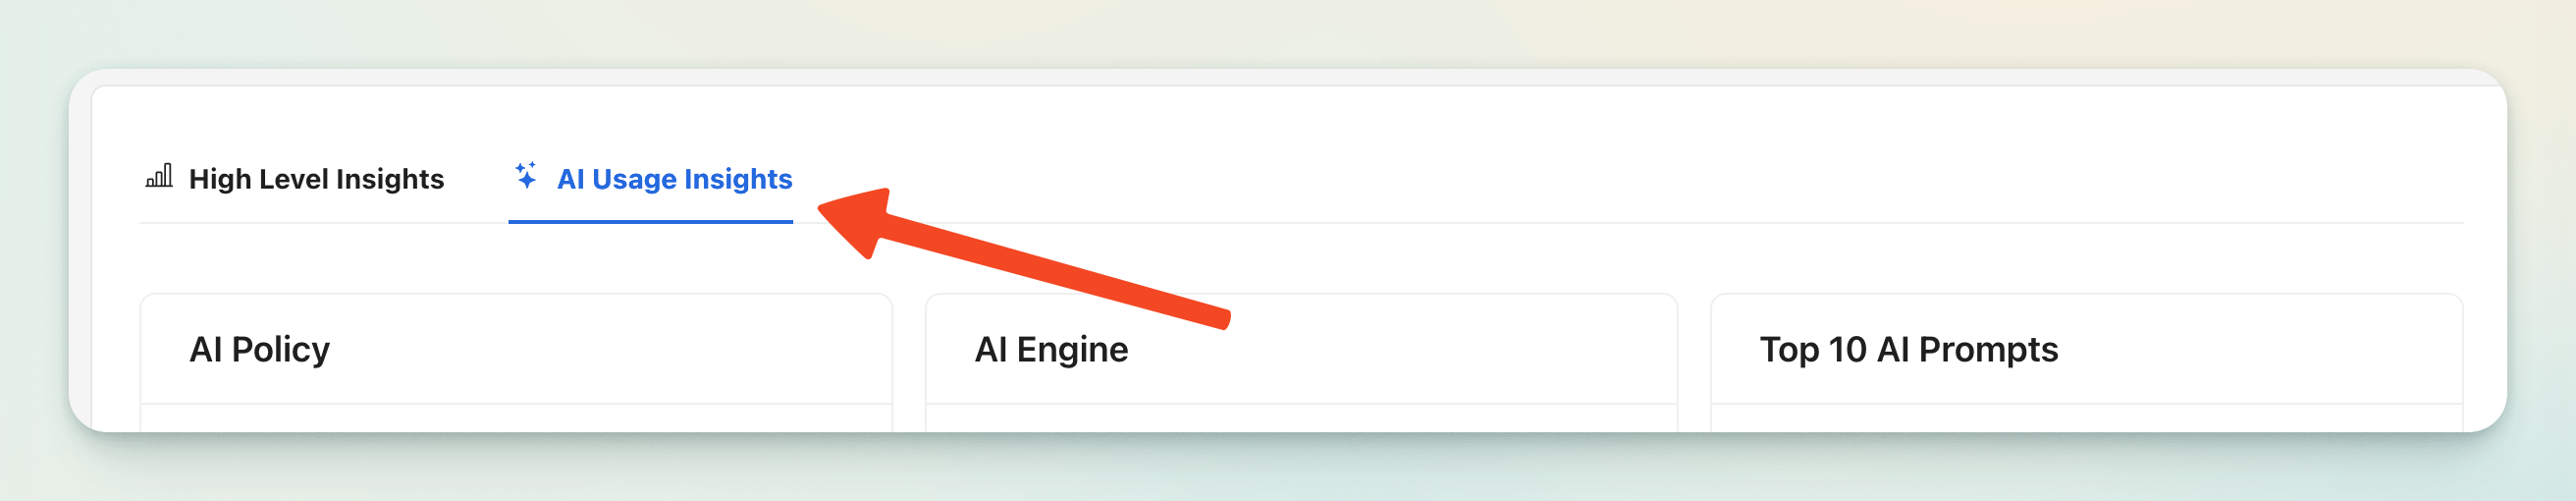
This tab dives into how AI is being used within classes, helping instructors and admins monitor patterns and evaluate the role of AI in learning.
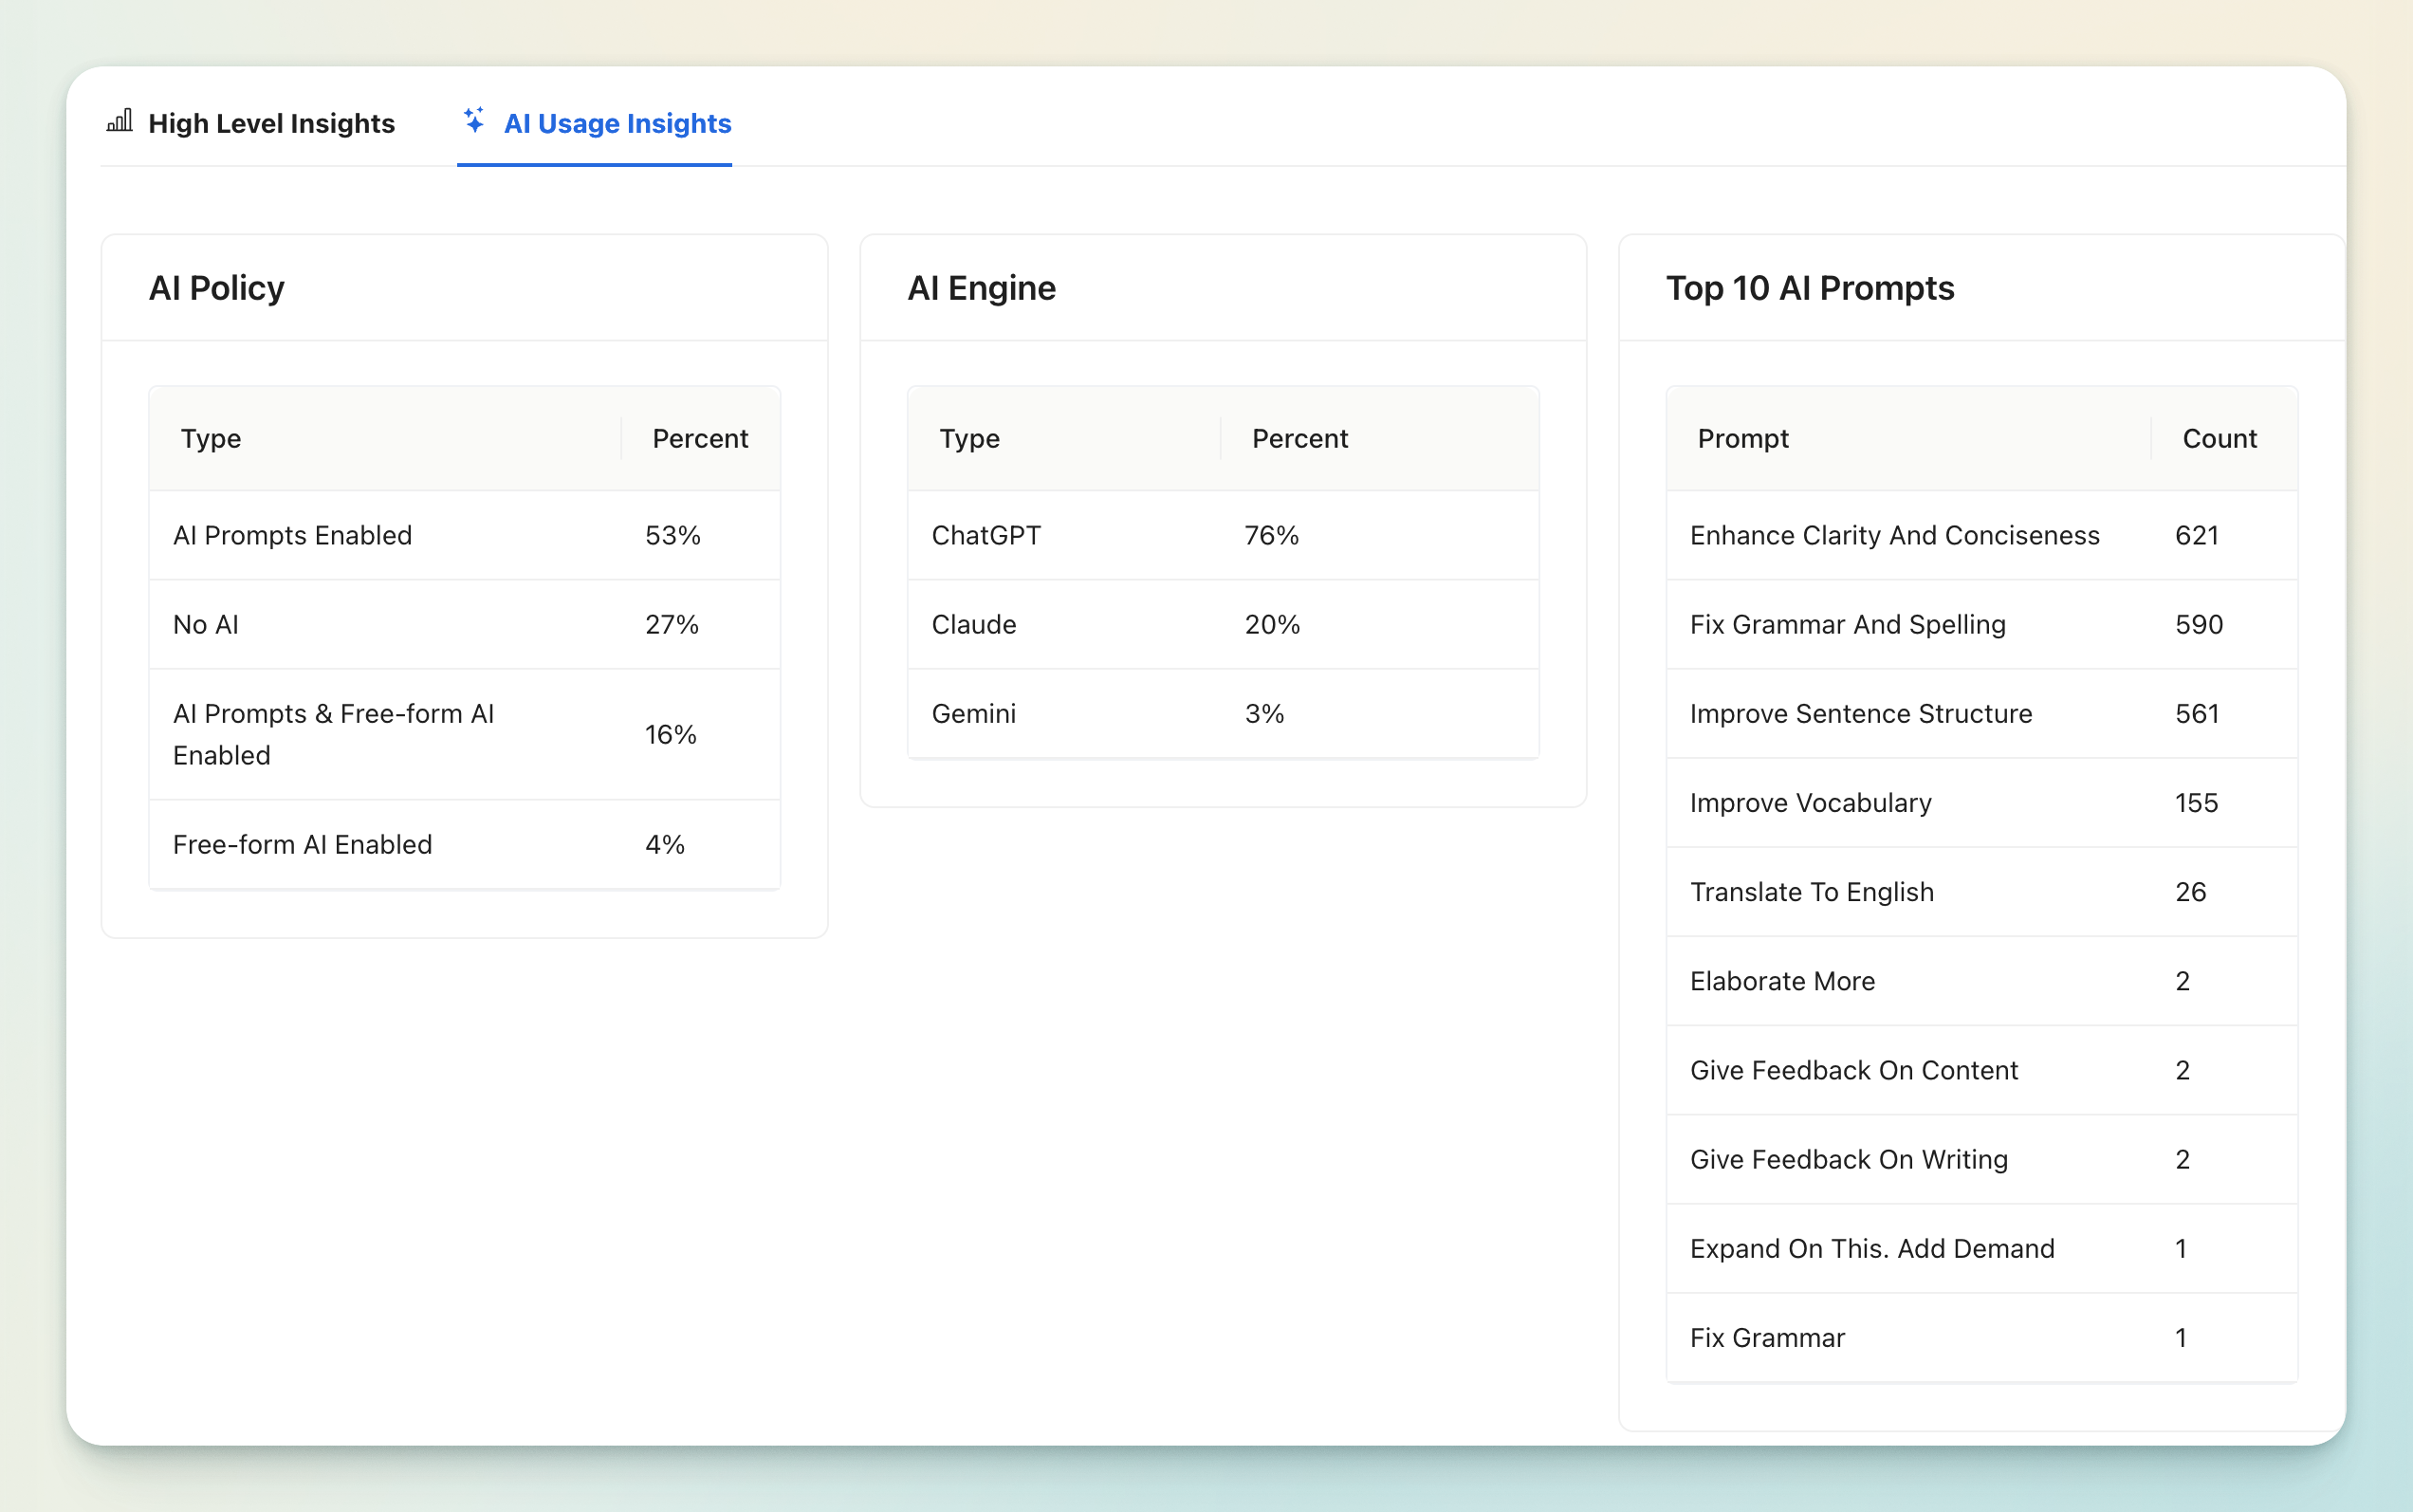
AI Usage Analytics
This section shows:
- The distribution of different AI Policies applied to assignments (set by instructors).
- The most popular AI engines being used.
- The top AI Prompts selected by students. Note: this only includes pre-set AI Prompts, not conversational AI prompts.
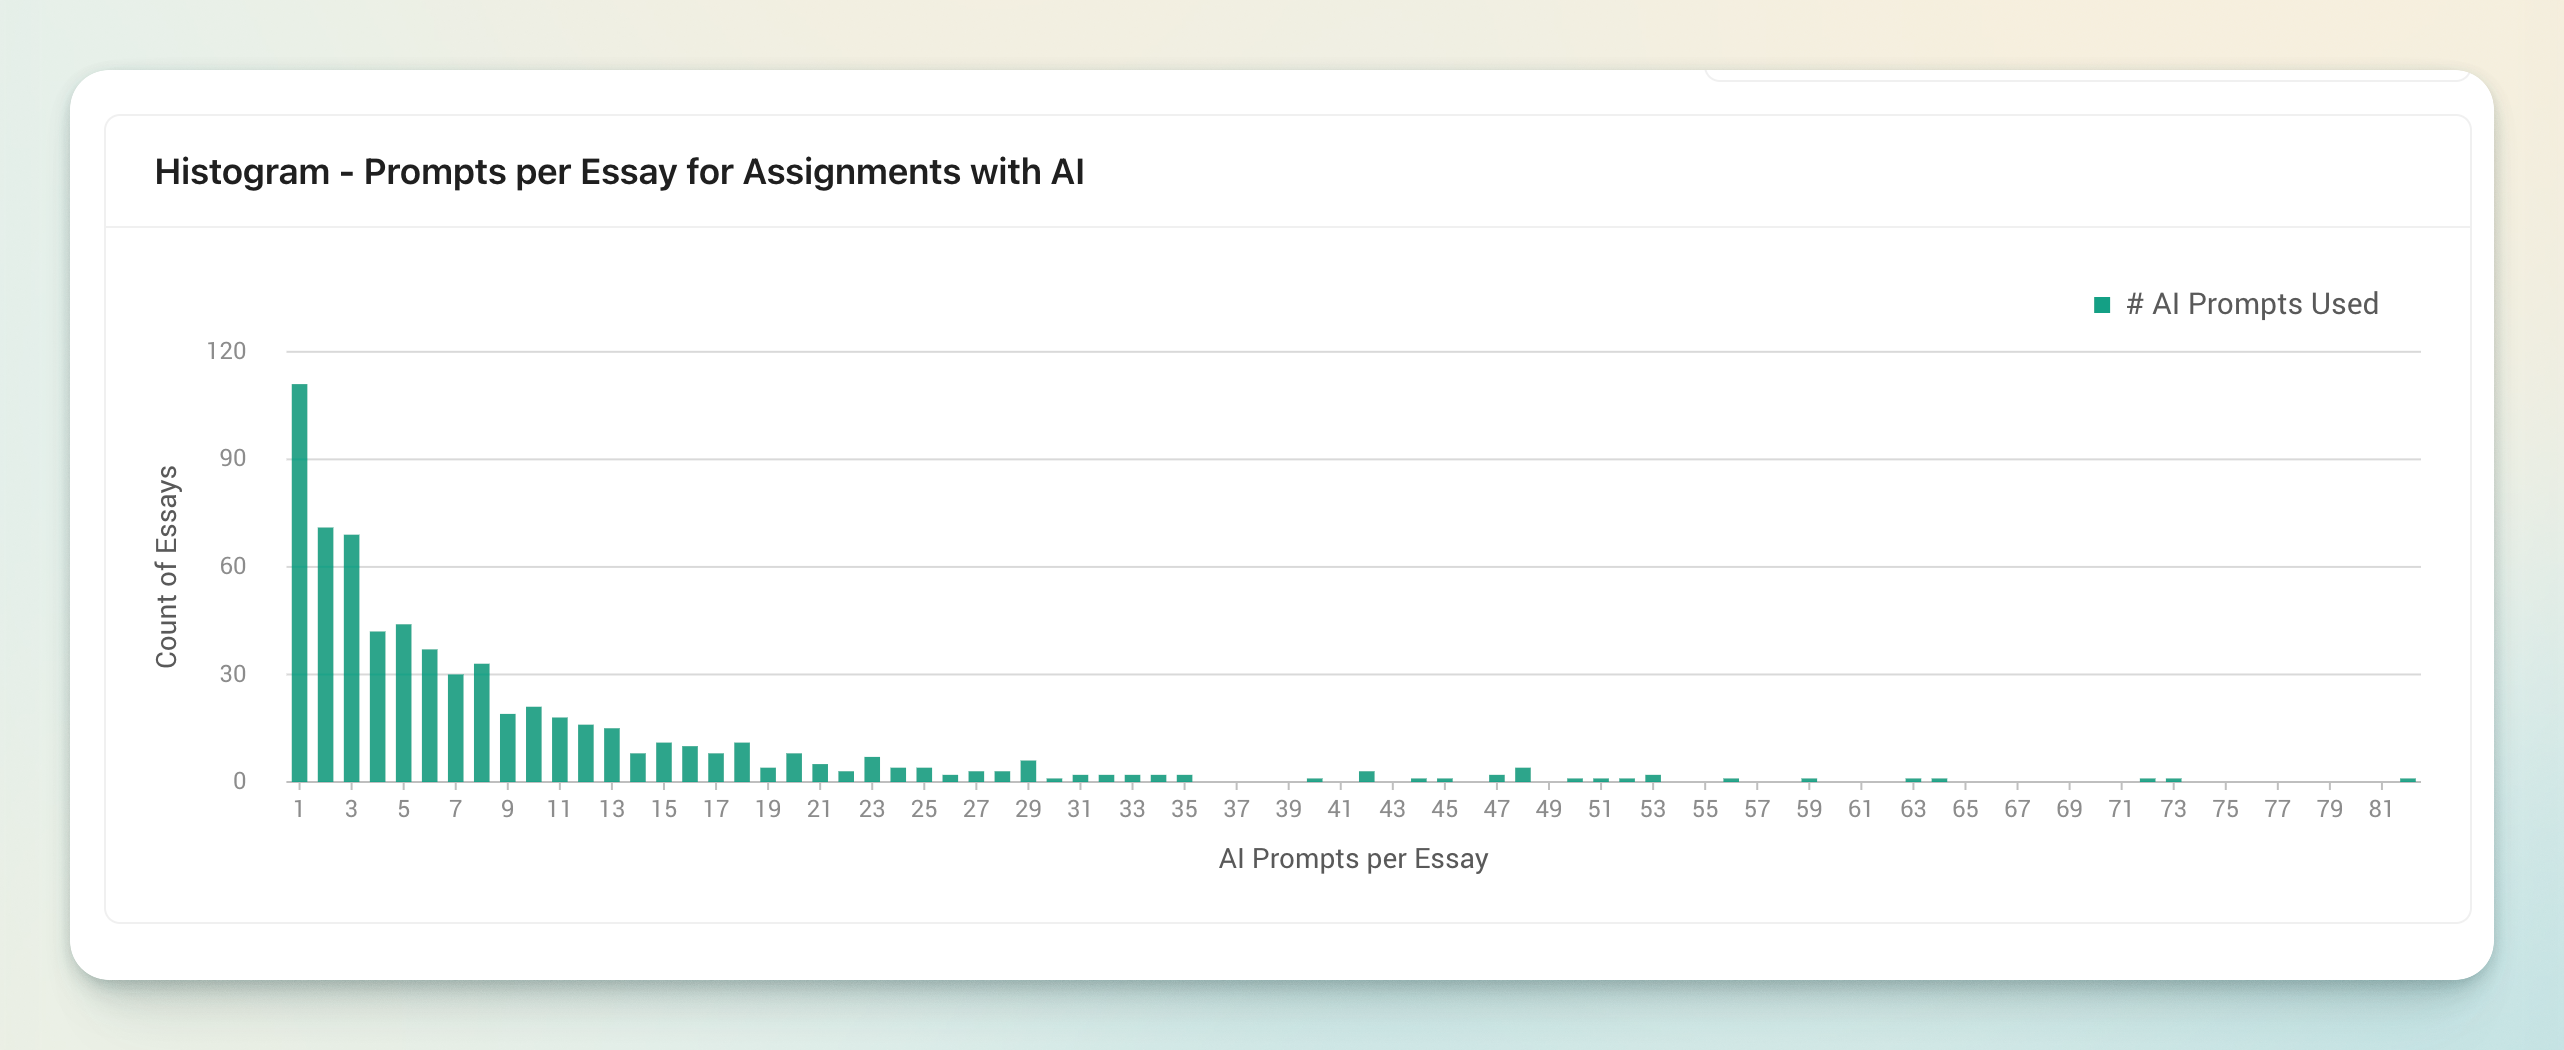
Prompts Per Essay
This chart illustrates the average number of prompts used per essay for assignments with AI enabled. It helps instructors see how frequently students are engaging with AI tools to improve their work.